What is the size of politics on Twitter?

A large amount of research on Political Science is dedicated to answer the problem of political participation, with authors like Robert Putnam, in “Bowling Alone” (1995), observing that in the last decades there was a decline in the level and intensity of political activity. At national level, the concept of political participation is commonly measured by the Vote Turnout on the elections, as this is the largest institutional channel of Political Participation; is perceived as the simplest act of citizenship (Putnam, 1995) and has the most accurate and longest time series amount of data.

But this measurement is not perfectly assessed, as many individuals might be politically active in other channels – as participation in an activist group, writing to a congressman, protesting, etc. Sometimes, political active individuals choose not to vote even in a way of protest. It is difficult to measure exactly how many citizens are politically active, but the number could be estimated on a survey that question if the individual was recently engaged in any of the possible channels of political participation.

One propose here a different way to assess the size of politics, by text-analysis using Boolean Operators on Twitter data, during the presidential election campaign on 12 Latin American countries between 2013 and 2014 – Ecuador, Venezuela, Paraguay, Chile, Honduras, Costa Rica, El Salvador, Panamá, Colombia, Bolivia, Brasil and Uruguay. The sample includes the four months before the first or single round and one month after the second or single round.

Methods
Only a small fraction of Twitter data is geographically located – basically the activity that is on mobile devices. To estimate how many Posts can be found in a country (representing all the social activity available in one nation), first was performed a query using as keywords the Profiles on Twitter of the news services (TVs, newspapers and magazines) affiliated to the Inter-American Press Society (IAPS).

After accessing the Posts related to news, we sampled 1.000 posts for each country, to perform a text-analysis on the words available on Tweets from each country. Finally, we used the words that had an intrinsically political meaning (names of politicians, or political institutions, actions, framing, slogans) to perform another query, using both news names AND political words. This search will give all the posts from news services that were related to politics. It is worthy-noting that the result includes not only the tweets originally publicized by the news services, but also the re-tweets.

We understand that this is a better measurement of political activity on Twitter, as the data is related to the total of activity on Twitter, with news posts as a proxy representing the tweets within a single country. Commonly, we can only observe the number of Tweets within a single topic. And even if we find that this topic is Trending, one can only speculate what it represents comparatively to all the other Tweet activity in the same day.

Findings
The results are in the following table. As expected, we can observe that there is a wide variation on the “size of politics” on Twitter, from 3% of Posts in Uruguay to 74% in Venezuela. But most of the countries have a very low amount of political messages on Twitter, under 20% – which is impressive considering that the posts were counted during the electoral time.

Table: Size of politics on Twitter during Latin American Election

Country News posts Politics posts Percentage Politics
Ecuador 646.086 63.119 10
Venezuela 5.944.929 4.414.143 74
Paraguay 469.844 39.551 8
Chile 899.027 65.797 7
Honduras 161.526 18.955 12
Costa Rica 153.542 24.156 16
El Salvador 337.541 50.260 15
Panamá 583.860 275.845 47
Colombia 5.327.258 837.028 16
Bolívia 63.557 12.760 20
Brasil 5.958.907 1.419.827 24
Uruguay 443.877 12.993 3
Total 20.989.954 7.234.434 34

Most interestingly, the outlier Venezuela has the most polarized electoral process, with only two main candidates obtaining nearly 50% of the votes each. To understand what are the reasons of this variation, one should conduct a more detailed analysis of the data. But we can assume that the explanation can be inferred not only by the analysis of the electoral and party system, but also by the media environment in each country and how it relates with the political institutions and actors.

It is also interesting to observe what are words found in most of the countries. impuestos (taxes), in 12 countries; presidente (president), in 11 countries; corrupción (corruption), in 10 countries; and gobierno (government), in 10 countries.

Next, we describe the parameters of the queries made on Twitter with Boolean Operators, and present a WordCloud of the most common terms, by country.
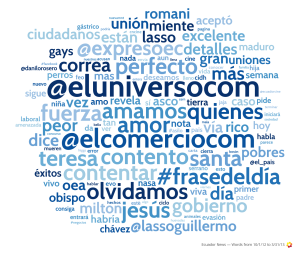
Ecuador
Ecuador
(@eluniversocom OR @elcomerciocom OR @Expresoec OR @revistavistazo OR @HOYcomec OR @lahoraecuador) AND (@chevron OR @lassoguillermo OR @mashirafael OR #debateec OR ciudadanos OR correa OR embajador OR exsecretario OR gays OR gobierno OR impuestos OR lasso OR nacional OR político OR rafael OR presidente)
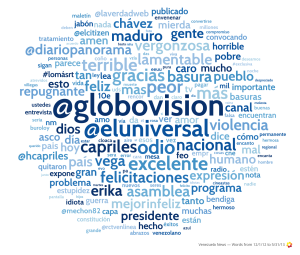
Venezuela
Venezuela
(@globovision OR @ElUniversal OR @RCTVenlinea OR @diariopanorama OR @6toPodermovil OR @elimpulsocom OR @laverdadweb OR @Diario_ElTiempo OR @2001OnLine) AND (@chavezcandanga OR @hcapriles OR asamblea OR capriles OR chavez OR chávez OR ciudadano OR fascistas OR guerra OR maduro OR país OR presidente OR venezuela)
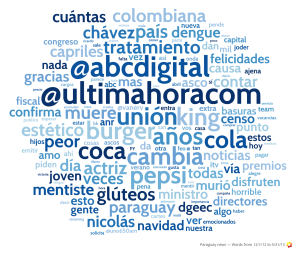
Paraguay
Paraguay
(@abcdigital OR @UltimaHoracom OR @vanguardiacde) AND (alegre OR cartes OR congreso OR destitución OR diputado OR electo OR fiscal OR gobierno OR impuestos OR irregularidades OR oposición OR políticos OR presidente)
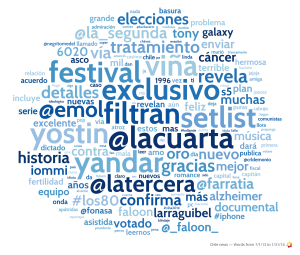
Chile
Chile
(@Emol OR @latercera OR @lacuarta OR @La_Segunda OR @DiarioLaHora OR @revistaqp OR @AmericaEconomia) AND (@fr_parisi OR bachelet OR comunistas OR derecha OR fiscal OR fronteras OR ideológico OR impuestos OR patria OR presidente OR votado OR votare)
Honduras
Honduras
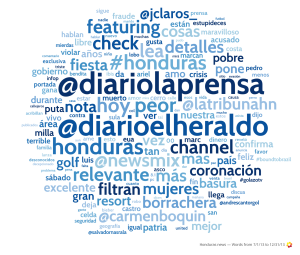
(@DiarioLaPrensa OR @diarioelheraldo OR @LaTribunahn) AND (@salvadornasrala OR @salvadornasrala OR alcalde OR alcaldía OR corrupción OR corrupto OR corruptos OR gobierno OR impuestos OR impuestos OR nacional OR nacionalista OR pac OR partido OR patria OR presidente OR salvador)
CostaRica
Costa Rica
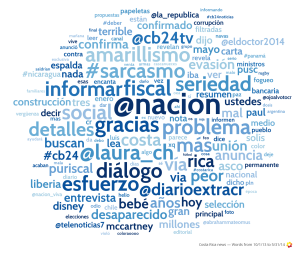
(@nacion or @DiarioExtraCR or @TheTicoTimes) or @cb24tv AND (@eldoctor2014 OR #crisisfiscalcr OR #eleccionescr OR araya OR autoridades OR candidatos OR constitución OR corrupción OR diálogo OR diputados OR elecciones OR evasión OR fiscal OR impuestos OR ministros OR nación OR pln OR política OR presidente OR pusc OR social OR solís)
ElSalvador
El Salvador
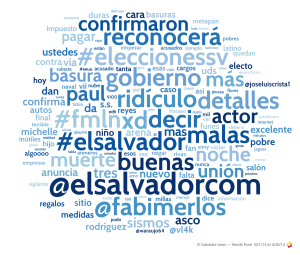
(@prensagrafica OR @elsalvadorcom OR @ElMundoSV) AND (@arenanuncamas OR @arenaoficial OR @norman_quijano OR #eleccionessv OR alcalde OR arena OR campaña OR cargos OR compañero OR corrupto OR diputados OR exonerados OR fisco OR gobierno OR impuesto OR impuestos OR partido)
Panama
Panamá
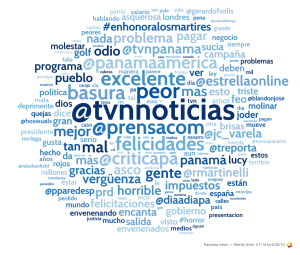
(@tvnnoticias OR @prensacom OR @CriticaPa OR @PanamaAmerica OR @EstrellaOnline OR @DiaaDiaPa OR @elsiglodigitalV OR @MetroLibrePTY OR @capitalpanama) AND (@jc_varela OR @jdariasv OR @juancanavarro OR campaña OR democracia OR gob OR gobierno OR impuestos OR ley OR navarro OR noriega OR partido OR patria OR política OR politico OR prd OR presidente OR salario OR varela OR votos)
Colombia
Colombia
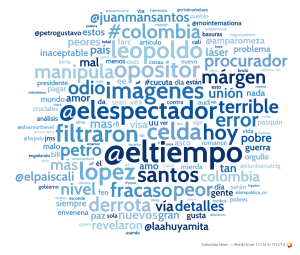
(@ELTIEMPO OR @elespectador OR @elcolombiano OR @elheraldoco OR @elpaiscali OR @lapatriacom OR @ElUniversalCtg OR @larepublica_co OR @vanguardiacom) AND (lópez OR @alvarouribevel OR @juanmansantos OR @las_farcep OR @opina_colombia OR #eltiempomiente OR 1eravuelta OR cañones OR corruptos OR elecciones OR farc OR gobierno OR guerra OR guerrilla OR impuestos OR opositor OR presidente OR santos OR terroristas OR uribe OR zuluaga)
Bolivia
Bolívia
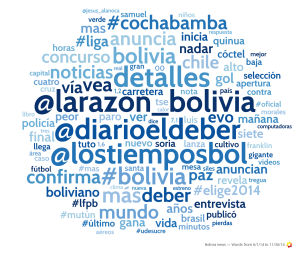
(@LaRazon_Bolivia OR @diarioeldeber OR @unitelbolivia OR @LosTiemposBol) AND (@boliviacomova OR @evompresidente OR @prisi41quiroga OR @yovotariaporevo OR #bolívar OR #eleccionesbo OR #mas OR cambios OR candidato OR candidatos OR elecciones OR gobernación OR gobierno OR impuestos OR morales OR partido OR paz OR policía OR presidente OR reinvindicación OR transportes)
Brazil
Brasil
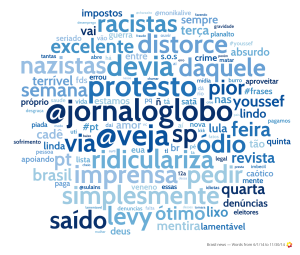
(@VEJA OR @JornalOGlobo OR @folha OR @Estadao OR @jornalnacional OR @RevistaEpoca OR @RevistaISTOE) AND (@dilmabr OR @dilmamentiu OR @leisparaquem OR @psdbmulherpr OR #abaixoódio OR #pt OR #youssef OR aécio OR campanha OR candidata OR corrupção OR corrupta OR corrupto OR corruptos OR debate OR democracia OR denúncia OR desemprego OR desmascarada OR dilma OR discurso OR eleições OR eleitores OR governo OR impostos OR incompetentes OR inflação OR levy OR luciana OR lula OR marina OR nazistas OR petistas OR planalto OR presidente OR protesto OR psdb OR pt OR racistas OR trabalhadoras OR youssef)
Uruguay
Uruguay
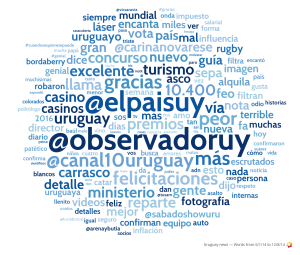
(@elpaisuy OR @ObservadorUY OR @canal10Uruguay OR @BUSQUEDAonline) AND (#debateateneo OR bordaberry OR colorados OR crisis OR drogadictos OR fiscales OR impuesto OR impuestos OR inflación OR oposición OR politólogo OR presidirá OR salarial)

Still unwritten: notes on text analysis in Political Science

One of the methods to be used in the Latin American Elections Project, the statistical analysis of political text is a promising tool for Political Science, as it makes possible to determine ideological position from texts, observe political interactions, and identify the content of political conflict. But one can observe that their use is still very restricted and focused on Presidential and Legislative Studies. In these two areas, topic analysis and other similar methods not only make sense but are mostly necessary to researchers that need to deal with massive amounts of texts, from datasets that can be easily accessed.

As an example, official and unofficial State of the Union addresses to outline proposals for the country define a large corpus of texts delivered each year since 1790. As Peters and Woolley observe in the American Presidency Project, their size varies from 1,089 words to 33,667. The last State of the Union, addressed by president Barack Obama, had 5,902 words. And we must observe that the State of the Union is only a small fraction of the gargantuan constellation of presidential action.

For those who work on Legislative Studies, the “Congressional Record” contains a record, taken stenographically, of everything said on the floor of both the House and the Senate, including roll call votes on all questions. The last available Congressional Record (CR vol. 160, no. 155, 12/16/2014) has 92 pages of text, giving an idea of what is the archive size. The publication started in 1873. One can find volumes since 1994 through the Federal Digital System, but the Library of Congress also makes available a collection of other journals, records, letters, documents and debates transcription of the US Congress, from 1774 to 1875, in the project A Century of Lawmaking for a New Nation.

And what about the other subfields?
We can discuss and review later some of the works that were done in Presidential and Legislative Studies, but what about the other subfields in Political Science? Their work on text analysis is still unwritten, as we may observe.

It is possible to find some literature on content analysis on Electoral Studies, but little use techniques where data-generation or text processing is automated. Comparative Judicial Studies are also a subfield that has an impressive amount of documents, but little work. Other areas that miss the use of statistical text analysis are Political Elites, Comparative Studies, Women and Politics, Democracy and Democratization in Comparative Perspective, Politics and Ethnicity, Public Opinion, Political Socialization and Education, Armed Forces and Society, Human Rights, Psycho-Politics, Public Policy and Administration, Political Development, Religion and Politics, International Politics, Political Economy… the list can go on and on.

One can only speculate on what are the reasons why political sciences don’t use statistical text analysis as much as they could do. But my suspect is that, while the technology of computational text analysis was being developed, many researchers in Political Communication were more dedicated to study the influence of television on politics.

Also, we can verify that the works on text analysis are much more common in American Politics than in Comparative Politics. I guess that in many countries researchers can’t find an organized corpus of texts, in the specific subject of their interests. Also, those who are dedicated to Comparative Politics and area studies would have to analyze texts written in different languages, making it more difficult to work in a single application. Many specialists also lack a proper training on the methods of computational text analysis, or might prefer other research approaches, like ethnography and quantitative analysis.

Long history of Political Text analysis
Another curious fact that might give more perspective on the use of these tools is the long history of political text analysis. In a special issue of Oxford’s “Political Analysis” (vol. 16, no.4), Burt Monroe and Philip Schrodt observe that the first modern, theoretically driven content analysis project was Harold Lasswell’s Wartime Communications Project just prior to the outbreak of World War II. Since then, the authors comment, content analysis became a standard analytical tool in the West, particularly for the analysis of “enemy” communications, first Nazist and later Communist.

But the corpus of political texts is much older. One can say that political text history goes back to the invention of writing itself, as some political organization was required to develop societies complex enough to create communication systems that would rely on writing. There are texts with content that could be described as formally political (and not religious) since 2,500 BC in Mesopotamia and 1,300 BC in China. Also, much of the classic literature is based on politics, including many of the writings of Plato and Aristotle, 2,400 years ago. Political texts were among the earliest publications after the introduction of printing in Europe, giving birth to an offspring of revolutions and social movements.

One of the first to use analysis of texts in the political process was the Italian humanist Lorenzo Valla. His philological analysis of the reputed “Donation of Constantine” in 1439 demonstrated, using textual methods, that the document was a medieval forgery that must have postdated the Emperor Constantine I by at least four centuries.

The first widely used computer program for automated content analysis was Harvard’s General Inquirer, during the 1960s. Until the mid-1990s, it only operated on large mainframe IBM computers that supported the PL/1 programming language. The system is still available today with PCs or Macs. Including its disambiguation routines for high-frequency English homographs, the General Inquirer makes it possible to process text files on the order of a million words an hour.

Monroe and Schrodt observe that tools with automated natural language processing were most developed in Europe, but continued to flourish in the computer sciences. Until the 1980s, application of text analysis was not very practical because it required a manual entry of text – at least as costly and time consuming as simply coding them directly from paper or microfilm (Monroe and Schrodt). But this changed in the 1990s, when texts became available on-line, free of charge. In recent years, automated content analysis in political science has experienced a considerable growth with several applications, among them Ken Benoit, Michael Laver and Will Lowe’s Wordscores.

Review of works on political text analysis
Following we review some of the most representative works on statistical text analysis in Political Science:

Presidential Studies:
Schonhardt-Bailey, Yager and Lahlou, 2012 – Use automated textual analysis to compare Ronald Reagan’s rhetoric with that of presidents Woodrow Wilson through Barack Obama, using their State of the Union speeches. They find statistical significance to the thematic content, with strong focus on civil religion rhetoric. There is also an apparent shif in modern presidential rhetoric, from themes concerned with institutions to ones focused on individuals, families and children.

Hart and Childers, 2004 – The study explores the first three years of the George W. Bush presidency focusing on verbal certainty in presidential rhetoric. Although verbal certainty has declined across presidential administrations during the past 50 years, the Bush presidency has resurrected it, perhaps because of personal or philosophical reasons and perhaps because of the unique circumstances created by the war on terrorism.

Olson, Ouyang, Poe, Trantham and Waterman, 2012 – Compares candidate Barack Obama’s campaign speeches with his governing speeches to determine if his rhetoric on the campaign trail provides the basis for his later governance. In general, Obama’s campaign and governing rhetoric are consistent, suggesting that he used the rhetoric of the campaign to help build a basis for governance. Most differences between presidential campaign rhetoric and governing rhetoric, at least in the case of Barack Obama, seem to be caused by the specifics of the political environment.

Hart, 2000 – Examines the dialogue between presidential candidates, citizens, and the press through a text analysis statistical program (DICTION). Hart identifies a centripetal function as centrist candidates tend to be successful candidates. conclusions are drawn from an extensive analysis of candidate speeches and debates, newspaper and broadcast coverage from major markets, and letters to the editor in 12 small cities (less than 100,000). It is this last source that is the most intriguing and debatable as Hart argues that letters to the editor give a less mediated view of citizen concerns than do poll results. Through an analysis of word usage, Hart is able to categorize campaign speech on five axes: certainty, optimism, activity, realism, and commonality.

Doherty, 2008 – Wiesehomeier and Benoit, 2009 – Examines the effects of rhetoric by presidential candidates, using Concordance (text-analysis software) to compile a listing of all occurrences of value keywords and their variants along with the string of words both before and after the keyword occurrence. Candidates are successful at using value rhetoric to modify public perceptions of their values as individuals. However, this rhetoric does not affect perceptions of party labels and individual candidates identically.

Lim, 2002 – Applying computer-assisted content analysis to all the inaugural addresses and annual messages delivered between 1789 and 2000, the author identifies and explores five significant changes in twentieth-century presidential rhetoric that would qualifiedly support the thesis of institutional transformation in its rhetorical dimension: presidential rhetoric has become more anti-intellectual, more abstract, more assertive, more democratic, and more conversational. These characteristics define the verbal armory ofthe modern rhetorical president.

Schonhardt-Bailey, 2005 – Computer-assisted content analysis Alceste is used to provide an impression of national and homeland security speeches by presidential candidates George W. Bush and John Kerry, in 2004.

Klebanov, Diermeier and Beigman, 2008 – Natural language processing software is based on the results of a multiperson annotation experiment that captures reliably identified connections between words in a text. The results are compared with a hand-made analysis of Margaret Thatcher’s rhetoric.

Legislative studies:
Grimmer, Messing and Westwood, 2012 – Uses a data set of over 170,000 House press releases issued between 2005 and 2010. We show that legislators use credit claiming messages to associate themselves with spending from many different sources. use a new data set of over 170,000 House press releases issued between 2005 and 2010. We show that legislators use credit claiming messages to associate themselves with spending from many different sources. Constituents are more responsive to the total number of messages sent rather than the amount claimed.

Quinn, Monroe, Colaresi, Crespin and Radev, 2010 – Describes a topic model for legislative speech, a statistical learning model that uses word choices to infer topical categories covered in a set of speeches and to identify the topic of specific speeches. Topic model examines the agenda in the U.S. Senate from 1997 to 2004. Using a new database of over 118,000 speeches (70,000,000 words) from the Congressional Record,  model reveals speech topic categories that are both distinctive and meaningfully interrelated and a richer view of democratic agenda dynamics than had previously been possible.

Monroe, Colaresi and Quinn, 2009 – Discuss a variety of techniques for selecting words that capture partisan, or other, differences in political speech and for evaluating the relative importance of those words. We introduce and emphasize several new approaches based on Bayesian shrinkage and regularization. We illustrate the relative utility of these approaches with analyses of partisan, gender, and distributive speech in the U.S. Senate.

Laver and  Benoit, 2003 – Presents a new way of extracting policy positions from political texts that treats texts not as discourses to be understood and interpreted but rather, as data in the form of words. This approach is compared to previous methods of text analysis and use it to replicate published estimates of the policy positions of political parties in Britain and Ireland, on both economic and social policy dimensions. Method is exported to a non-English-language environment, analyzing the policy positions of German parties, including the PDS as it entered the former West German party system. Finally, application goes beyond the analysis of party manifestos, to the estimation of political positions from legislative speeches. “Language-blind words coring technique successfully replicate published policy estimates without the substantial costs of time and labor that these require.

Grimmer, 2010 – Introduce a statistical model that attends to the structure of political rhetoric when measuring expressed priorities: statements are naturally organized by author. The expressed agenda model exploits this structure to simultaneously estimate the topics in the texts, as well as the attention political actors allocate to the estimated topics. The method is applied to a collection of over 24,000 press releases from senators from 2007, which is an ideal medium to measure how senators explain their work in Washington to constituents. A set of examples validates the estimated priorities and demonstrates their usefulness for testing theories of how members of Congress communicate with constituents.

Slapin and Proksch, 2008 – Proposes a scaling algorithm called Wordfish to estimate policy positions based on word frequencies in texts. The technique allows researchers to locate parties in one or multiple elections. We demonstrate the algorithm by estimating the positions of German political parties from 1990 to 2005 using word frequencies in party manifestos. The extracted positions reflect changes in the party system more accurately than existing time-series estimates. In addition, the method allows researchers to examine which words are important for placing parties on the left and on the right. We find that words with strong political connotations are the best discriminators between parties.

Judicial Studies
Wedeking, 2010 – Performs factor analysis on legal documents associated with 110 cases on the Supreme Court, verifying the frames. Proposes and develops a measure of a typology of issue frames and provide empirical evidence that supports a strategic account of how parties frame cases.

Owens and Wedeking, 2011 – Examination of the clarity of Supreme Court opinions, resulting that ideology does not predict clarity in majority or concurring opinions.

Others:
Shellman, 2008 – Describes a new machine-coded event data set specifically designed to study the spatially, temporally, and tactically disaggregated actions of multiple state and nonstate actors in a systematic fashion. The project develops an extensive set of dictionaries for multiple actors and employs a new coding scheme to organize information on such actors and their behavior. The author describes the machine content-analysis methods used to collect the data and the newly developed coding scheme.

Woolley, 2000 – Uses media-based data series to analyze monetary policy and discusses potential bias, error and opportunites for scholars to create media-based data .

Shortell, 2004 – Exploratory content analysis of five black newspapers in antebellum New York State. Computerized content analysis coded for themes, rhetoric, and ideology in a sample of more than 36,000 words of newspaper text. Although the discourse of black abolitionism is a social critique, it also contains a positive assertion of what free blacks would become. As important as the theme of “slavery” was to the discourse, so too were “colored” and “brotherhood.”

Notes on the project

The project – and this blog – intends to analyze presidential election campaigns on Twitter in a comparative study of 12 Latin American countries between 2013 and 2014 – Ecuador, Venezuela, Paraguay, Chile, Honduras, Costa Rica, El Salvador, Panamá, Colombia, Bolivia, Brasil and Uruguay. The sample includes 41 candidates, selected using the effective number of candidates in each electoral process. The formula is based on the measurement of the effective number of parties, as proposed by Laakso and Taagepera (1979), and considers the number of valid votes in the first or only round.
The effective number of candidates varies between 2.0, in Venezuela, and 4.45, in Costa Rica. In countries where the effective number of candidates is fractionated, representing the votes of weaker politicians, the decision was to add one more candidate in the sample.

As an example, in El Salvador’s election there were five candidates: Salvador Sánchez (48.9% of the votes), Norman Quijano (38.9%), Tony Saca (11.4%), René Rodrigues (0.4%) and Óscar Morales (0.3%). As the effective number of candidates is 2.5, the sample includes the three main candidates: Sánchez, Quijano and Saca. It is worthy-noting that each of the 41 candidates received more than 5% of the votes.

From the 12 countries, 4 had candidates running for reelection – Rafael Correa, in Ecuador; Juan Manuel Santos, in Colombia; Evo Morales, in Bolivia, and Dilma Rousseff, in Brazil. Other two candidates had been presidents before: Michelle Bachelet, in Chile, and Tabaré Vazquez, in Uruguay. All of these six candidates won.

In eight countries – Ecuador, Venezuela, Chile, Costa Rica, El Salvador, Bolivia, Brazil and Uruguay – left wing candidates were (re)elected, following the trend in Latin America since the last decade (Castañeda, 2006).

Some of the questions this project intends to answer are:
– How each candidate organizes the campaign and what is the structure of his social network depending if the politician is governist or oppositionist (and how the government is evaluated); if he belongs to a left, center or right-wing party, a small or a larger party, or which segment of the population he intends to represent (urban, rural, lower, middle, upper classes)?
– What is the variation inter-polity, depending on the institutional environment: effective number of parties, presidential electoral formula (plurality vs. majority), reelection, funding and spending, concurrent or non-concurrent with the election of the lower or single House, media structure and press freedom?
– Which issues are driving negative or positive messages on Twitter, according to the candidate and the system?
– Is it possible to predict the election result with Twitter data?
– What other social, demographic and economic variables can affect the elections and the campaign on Twitter: growth, inflation, size of the country, percentage of urban vs. rural population, inequality, violence, order?